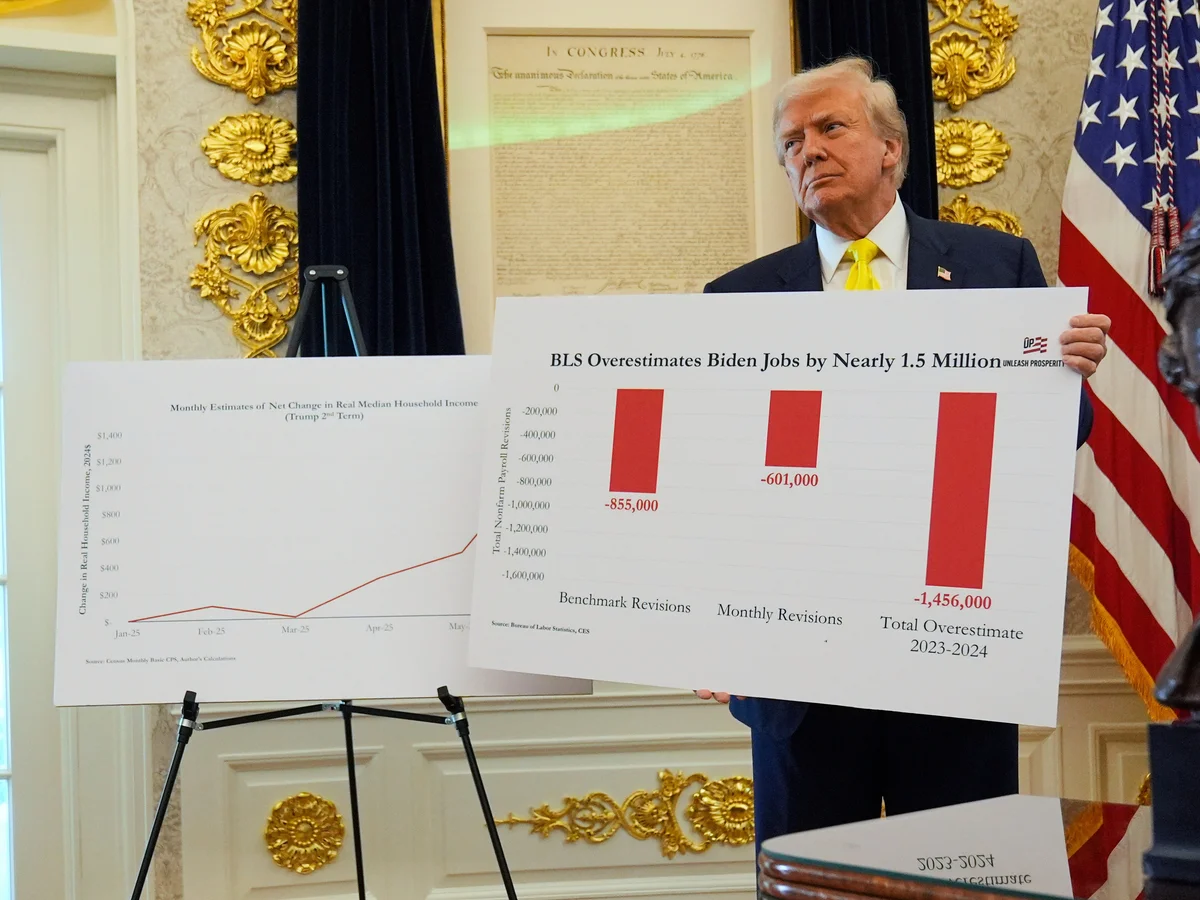
The monthly US jobs report, officially known as the Employment Situation Summary, is one of the most closely watched economic indicators. It offers vital insights into the health of the U.S. labor market, informing policymakers, investors, and the public about employment trends, wage growth, and overall economic vitality. The report’s figures often influence financial markets, government policies, and political rhetoric.
Given its prominence, it’s no surprise that political figures, including former President Donald Trump, frequently scrutinize and sometimes criticize the report. Trump and his supporters have claimed that these figures are “rigged” or manipulated to favor a particular narrative. To understand these claims, it is essential to examine exactly how the jobs report is calculated and what factors can influence its accuracy and perception.
How Is the US Jobs Report Calculated?
The creation of the US jobs report involves complex data collection and statistical methods carried out primarily by the U.S. Bureau of Labor Statistics (BLS). The process includes several key components:
Survey Data Collection
The BLS relies on two main surveys to gather employment data:
- Current Population Survey (CPS): Conducted monthly among approximately 60,000 households, this survey determines employment status, unemployment, and labor force participation.
- Establishment Survey (also known as the Payroll Survey): This survey collects data from about 145,000 businesses and government agencies, focusing on payroll job counts across various industries.
Data Processing and Analysis
Once the data are collected, statisticians analyze them to estimate the number of jobs added or lost, unemployment rates, part-time versus full-time employment, and other relevant statistics. The figures are then seasonally adjusted to account for recurring annual seasonal patterns such as holiday hiring or school vacations.
Key Indicators Reported
The main figures in the report include:
- Non-farm payroll employment change: The net number of jobs gained or lost in the economy during the month.
- Unemployment rate: The percentage of the labor force that is jobless but actively seeking employment.
- Labor force participation rate: The proportion of working-age individuals either employed or actively looking for work.
- Average hourly earnings: A measure of wage growth trends.
Why Do Critics Like Trump Say the Report Is ‘Rigged’?
Despite the rigorous methods used by the BLS, critics have argued that the jobs report can be manipulated or misrepresented. Donald Trump prominently voiced such claims, asserting that the figures are “rigged” to portray an overly positive or negative image depending on political needs. Understanding these allegations involves examining both the potential pitfalls in data reporting and the political context.
Possible Reasons Behind the Claims
- Political Motivations: Leaders might dispute unfavorable numbers and promote narratives that align with their agendas.
- Data Revisions: The initial reports are often revised in subsequent months as more comprehensive data become available, which can create perceptions of inconsistency or manipulation.
- Sampling Errors and Limitations: Like all statistical surveys, the CPS and establishment surveys are subject to sampling errors, which can sometimes lead to discrepancies.
- Difficulty in Measuring Informal Employment: The official data primarily capture formal employment, potentially missing significant parts of the economy such as gig work or undocumented jobs.
Is the Data Truly ‘Rigged’?
While critics, including Trump, claim that the jobs report is rigged, most experts agree that the data collection and analysis process is scientifically rigorous and transparent. The BLS adheres to strict statistical standards and regularly undergoes audits and peer reviews to ensure data integrity.
However, it is also true that the interpretation of this data can be influenced by various biases or political motivations. For instance, a decline in reported employment might be downplayed by political figures seeking to bolster their claims of economic strength, while a strong report might be exaggerated as a sign of economic success.
Understanding the Limitations and Revisions
One critical aspect often overlooked is that the jobs report is not infallible. It is inherently subject to revisions. Initial estimates are based on partial data and come with margins of error. These figures are refined in subsequent months as more complete information is processed, sometimes leading to significant revisions of initial reports.
Examples of Data Revisions
- Sometimes, initial reports underestimate job gains, which are later revised upward.
- Conversely, initial figures showing strong employment growth may be revised downward upon review.
Conclusion: A Tool with Pros and Cons
The US jobs report remains a crucial economic indicator, but it is essential to interpret its findings with an understanding of its limitations. Claims of manipulation are often rooted in political agendas rather than factual inaccuracies, but skepticism must be balanced with recognition of the rigorous processes involved.
In essence, while the data collection methods are robust and transparent, the interpretation and political framing of these numbers can be subjective. As consumers of this information, a critical approach that considers revisions, context, and statistical limitations is vital.
Final Thoughts
The controversy surrounding the US jobs report underscores the importance of transparency and understanding in economic reporting. It’s essential to critically assess claims like those from Trump about the report being “rigged” and to recognize the distinction between methodological issues and political rhetoric.
By grasping how the data are gathered and processed, the public can make more informed judgments about the health of the economy and the reliability of the reported figures.
For more updated news please keep visiting Prime News World.


